Best Mutual Funds for SIP Retirement Planning: Why Index Funds Win
When planning critical milestones like retirement or a child's higher education, establishing a reliable, predictable investment strategy is essential. Understanding how active fund managers perform against market benchmarks reveals why passive index investing is rapidly becoming the gold standard for long-term wealth creation.
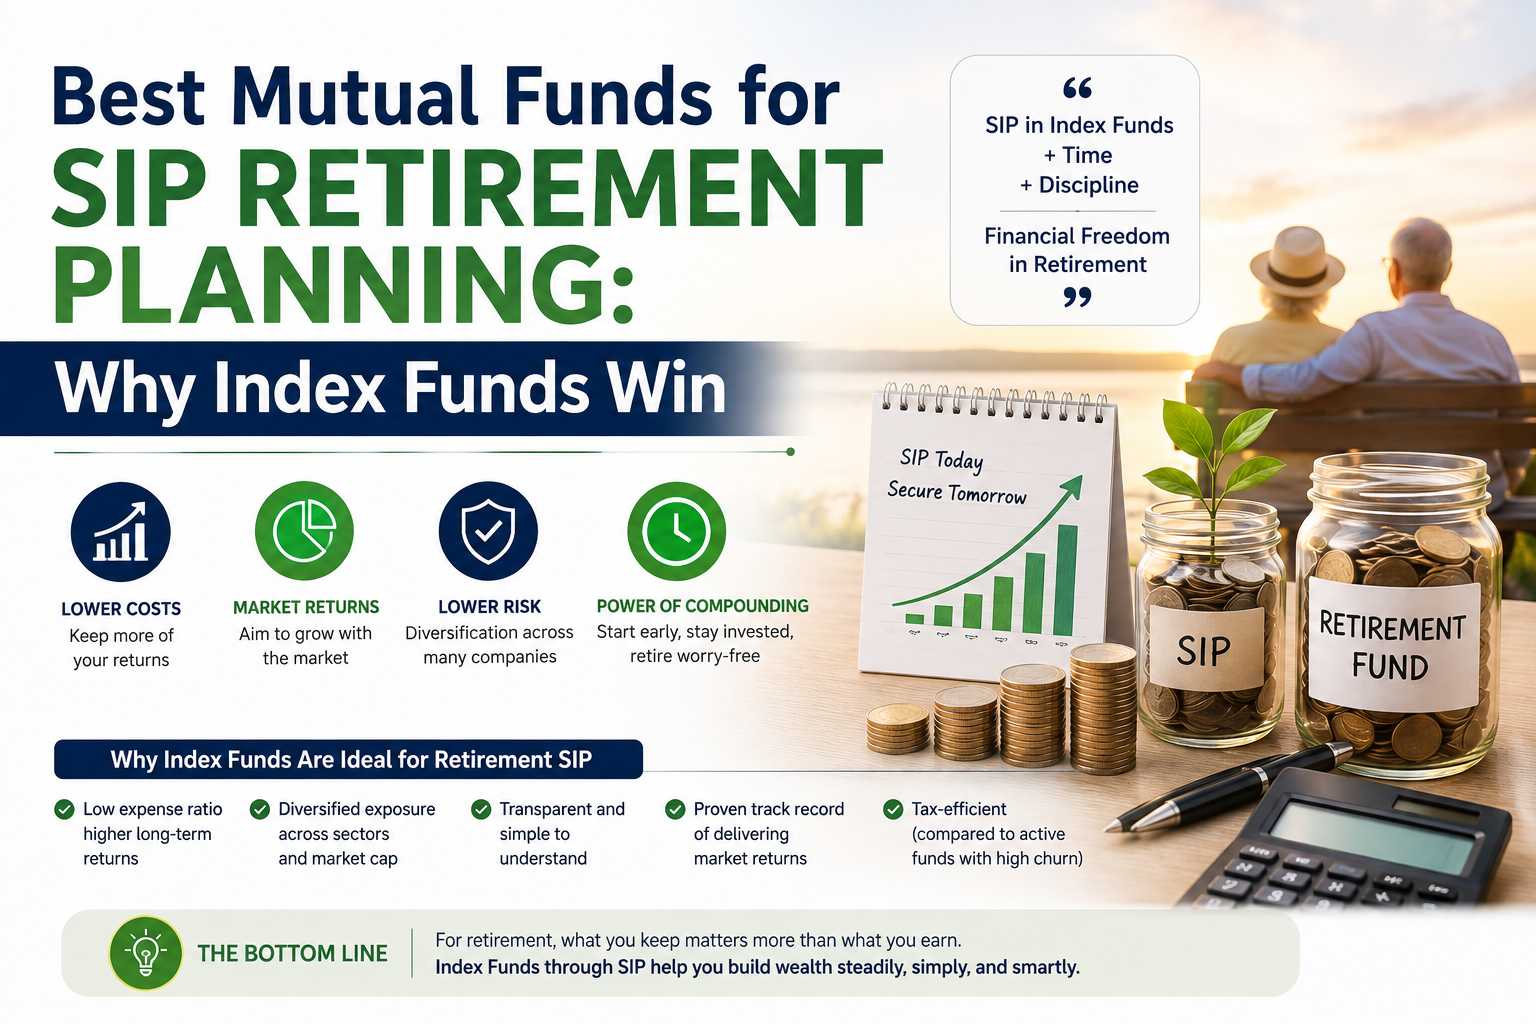
Best Mutual Funds for SIP Retirement Planning: Why Index Funds Win
Finding the best mutual funds for SIP retirement planning can feel overwhelming in a market flooded with hundreds of options across various categories. Most retail investors default to selecting funds based purely on recent 1-to-3-year returns, hoping past winners will secure their future financial goals. However, chasing short-term outperformance often leads to portfolio underperformance, unexpected volatility, and long-term frustration.
When planning critical milestones like retirement or a child's higher education, establishing a reliable, predictable investment strategy is essential. Understanding how active fund managers perform against market benchmarks reveals why passive index investing is rapidly becoming the gold standard for long-term wealth creation.
The Hidden Danger of Chasing Past Performance in Active Mutual Funds
Selecting active mutual funds based solely on recent high returns is one of the most common mistakes in personal finance. Market dynamics change rapidly, and top-performing funds in a bull market frequently drop to the bottom during market corrections.
When an active fund underperforms over two or three years, investors face a difficult dilemma: should they hold, sell, or stop their Systematic Investment Plan (SIP)? This constant decision-making fatigue often results in selling low and buying high, severely damaging compounding returns over time.
Metric | Active Mutual Funds | Passive Index Funds |
Expense Ratio | 0.50% - 1.50% | 0.10% - 0.20% |
Manager / Human Risk | High (Stock selection) | Zero (Rules-based) |
10-Yr Benchmark Beat Rate | < 30% - 40% | ~100% (Less Tracking Error) |
Portfolio Churn & Fees | High | Low |
What SPIVA Data Reveals: The Active Fund Underperformance Crisis
Rigorous financial research demonstrates that outperforming market benchmarks consistently over long horizons is exceptionally rare for active fund managers. According to the benchmark S&P Indices Versus Active (SPIVA) India Scorecard, the vast majority of active funds fail to beat their benchmark indices.
Fund Category | 1-Year Underperformance | 3-Year Underperformance | 5-Year Underperformance | 10-Year Underperformance |
Large-Cap Active Funds | 52% | > 80% | > 80% | > 60% |
Mid & Small-Cap Active Funds | 73% | ~60% | ~60% | > 70% |
Even during strong market rallies, nearly three out of four active mid-cap and small-cap funds fail to outperform their benchmark index. Over a 10-year horizon, over 60% of large-cap funds and 70% of mid/small-cap funds underperform, proving that active stock selection carries substantial long-term risk.
Risk-Adjusted Returns: Balancing Large, Mid, and Small-Cap Exposure
During market bull runs, investors frequently over-allocate to mid-cap and small-cap mutual funds because their short-term returns look extraordinary. However, these market segments are highly volatile and experience severe drawdowns during market corrections.
Historical 20-year index performance demonstrates that while small-cap and mid-cap indices generate slightly higher returns than large-cap indices, the long-term difference narrows significantly after accounting for market pullbacks.
Index Category
CAGR (%)
Risk / Volatility Profile
Nifty 50 (Large-Cap)
14% - 15%
Low - Baseline Downside Protection
Nifty Midcap 150
16% - 17%
Moderate-High Cyclical Fluctuations
Nifty Smallcap 250
17% - 18%
High Cyclical Drawdown Risk
Nifty 50 Index (Large-Cap): Delivers historical returns of 14%–15% CAGR with strong downside protection and lower volatility.
Nifty Midcap Index: Generates historical returns of 16%–17% CAGR with moderate-to-high market volatility.
Nifty Smallcap Index: Provides historical returns of 17%–18% CAGR, accompanied by extreme cyclical drawdown risk.
Core Investment Principle: Focus on risk-adjusted returns rather than absolute returns. A balanced portfolio across market capitalizations helps withstand market cycles without forcing panic sales. |
Why Index Funds are the Best Choice for Long-Term Goals
Passive index funds offer an efficient, low-cost solution for long-term wealth accumulation. By replicating broader market indices, index funds eliminate fund manager bias and deliver consistent market-linked performance.
The explosive growth of passive investing reflects this shift; passive mutual fund Assets Under Management (AUM) in India expanded nearly six-fold from ₹1.77 Lakh Crore to over ₹10 Lakh Crore within five years, projected to reach ₹25–30 Lakh Crore by 2030.
Year / Horizon | Assets Under Management (AUM) |
5 Years Ago | ₹1.77 Lakh Crore |
Recent Milestone | ₹10.00+ Lakh Crore |
2030 (Projected Target) | ₹25.00 - ₹30.00 Lakh Crore |
Key Advantages of Index Fund Investing
Ultra-Low Expense Ratios: Index funds charge minimal expense ratios of 0.1% to 0.2%, compared to 0.5% to 1.5% for active direct mutual funds. A 1% annual fee savings compounds into significant wealth over a 20-to-30-year period.
Automated Market-Linked Rebalancing: Index funds dynamically adjust holdings based on free-float market capitalization. Underperforming companies are automatically removed, while growing companies enter the index.
Zero Fund Manager Risk: Investment performance relies strictly on transparent index rules rather than an individual stock picker's decisions or subjective calls.
Evaluating Top Index Categories for Your SIP Portfolio
Choosing the right index category depends on your risk tolerance and asset allocation strategy. Selecting the right category ensures proper exposure across market caps.
Index Category | Large-Cap Exposure | Mid & Small-Cap Exposure | Best Suited For |
Nifty 50 / Nifty 100 | 100% | 0% | Conservative & Core Retirement Investors |
Nifty 500 | 65% – 70% | 30% – 35% | Broad Market Whole-Economy Exposure |
Nifty LargeMidcap 250 | 50% (Top 100) | 50% (Top 150 Mid) | Growth-Oriented Balanced Investors |
Understanding Tracking Error and Cash Drag
While index funds aim to replicate index performance perfectly, minor differences known as tracking error occur. Tracking error arises primarily from fund expense ratios, cash balances held for redemption liquidity (2%–5%), and trade execution timing.
Large-cap index funds like Nifty 50 typically exhibit lower tracking error due to high underlying stock liquidity and ultra-low management costs compared to mid-cap or small-cap indices.
Financial Advice Disclaimer
This article is prepared for informational and educational purposes only and does not constitute personalized financial, investment, legal, or tax advice. Mutual fund investments are subject to market risks; read all scheme-related documents carefully before investing. Past historical returns and index performance are not guarantees of future results. Consult a certified financial advisor to tailor investments to your specific financial situation.

CFA, MBA and former corporate CFO with 18 years of global financial experience across the US, UK and India. Sasikumar writes jargon-free, actionable guides on mutual funds, ETFs and retirement planning for Indian investors.